In just one year, solar panels installed on the roof of St. Simon of Cyrene in Lincoln Heights have generated over 19,000 kilowatt-hours (kWh) of electricity. That translates to $1,600 in savings for the congregation.
St. Simon’s solar energy system was funded by a $15,000 gift, $4,096 from the church budget, and a matching grant from the Solar Moonshot program of the BQuest Foundation. Its first full day of operation was July 29, 2022. In February, March, April and May, electrical production from the panels exceeded electricity usage.

Ken Wright, a member of the congregation who serves on the Creation Care and Environmental Justice Commission, has provided technical details about the solar installation:
The Equipment
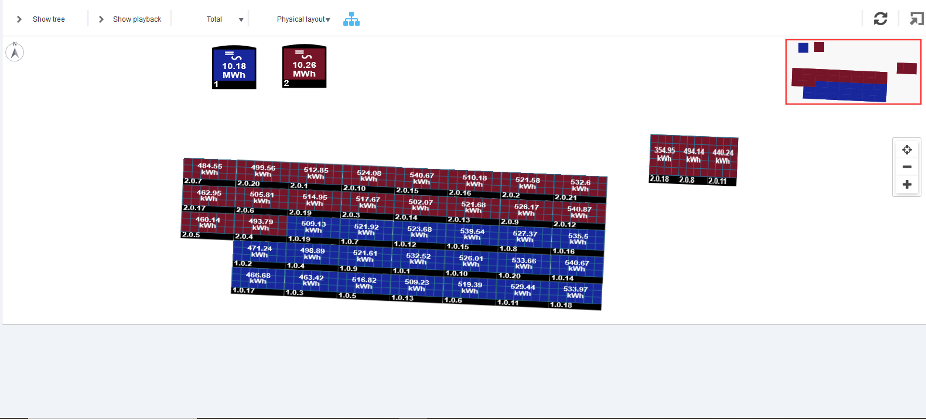
The system consists of 41 Silfab SIL-370-HC-20220216 panels (370Watt) were flush mounted on our administrative building’s roof using Ironridge Flashfoot 2 attachments. The roof was re-covered the previous year with asphalt singles. The roof slope is 23°. The orginal plan was for all 36 panels to be mounted on the main roof area, but when the installers arrived at the site, they realized that the roof could accommodate only 39 panels. The remaining 3 were installed on the roof of the breezeway between the administration building and the parish hall. Because of the difference in roof elevations these panels get more afternnon shading and so their production is not quite as good as the other 39. There is minimal shading from the higher sanctuary roof to the west. The panel layout is shown in Figure 1.
The panels are connected together into two strings with Solar Edge P505 optimizers for each panel. The direct current eletricity from each string of panels is fed into two Solar Edge SE7600H-US inverters. These inverters convert the direct current into alternating current at line voltage to match the power being fed into the church by the utility, Duke Energy. The output of the inverters is monitored and fed to a digital Solar Edge app so that the system output can be tracked in real time and well as provide access to past production.
The utility requires all PV systems to be “behind the meter,” that is, connected on the user side of the electric meter. If there is more than one meter, as is the case for St. Simon’s, then the power generated by the PV system can only be used to offset the needs of circuits fed by that meter. Thus St. Simon’s second meter, used for the rectory, does not benefit from the presence of the PV system. We chose to place the system behind adminstration bulding meter (#108149853) because it is the largest of the two, accounting for about 75% of the total electricity use and cost.
Production Data
Month by month production:
| Month | kWh | Max day kWh | Min day kWh |
| Aug 2022 | 2073 | 93.4 | 42.7 |
| Sep 2022 | 1850 | 82.4 | 11.8 |
| Oct 2022 | 1760 | 79.7 | 10.1 |
| Nov 2022 | 1180 | 64.5 | 0.4 (a) |
| Dec 2022 | 707 | 55.9 | 2.6 (b) |
| Jan 2023 | 640 | 54.4 | 0.2 (c) |
| Feb 2023 | 1380 | 75.9 | 10.8 |
| Mar 2023 | 1500 | 93.7 | 1.2 (d) |
| Apr 2023 | 1840 | 95 | 9.2 |
| May 2023 | 2300 | 101 | 22.5 |
| Jun 2023 | 2010 | 95.5 | 22.7 |
| Jul 2023 | 2180 | 92 | 31.1 |
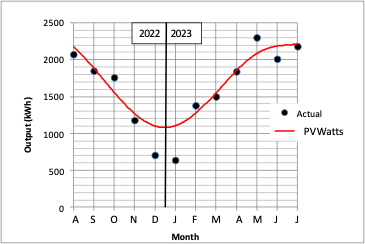
Our best month of the year was May 2023 (2300 kWh) and our worst month was January 2023 (640 kWh). Normally you would expect June to be the best month and December the worst, since those months have the most and least hours of daylight, respectively, but weather plays a strong role.
Overall for the whole year the system produced within 4% of what was expected from average solar data on the web site https://pvwatts.nrel.gov/.
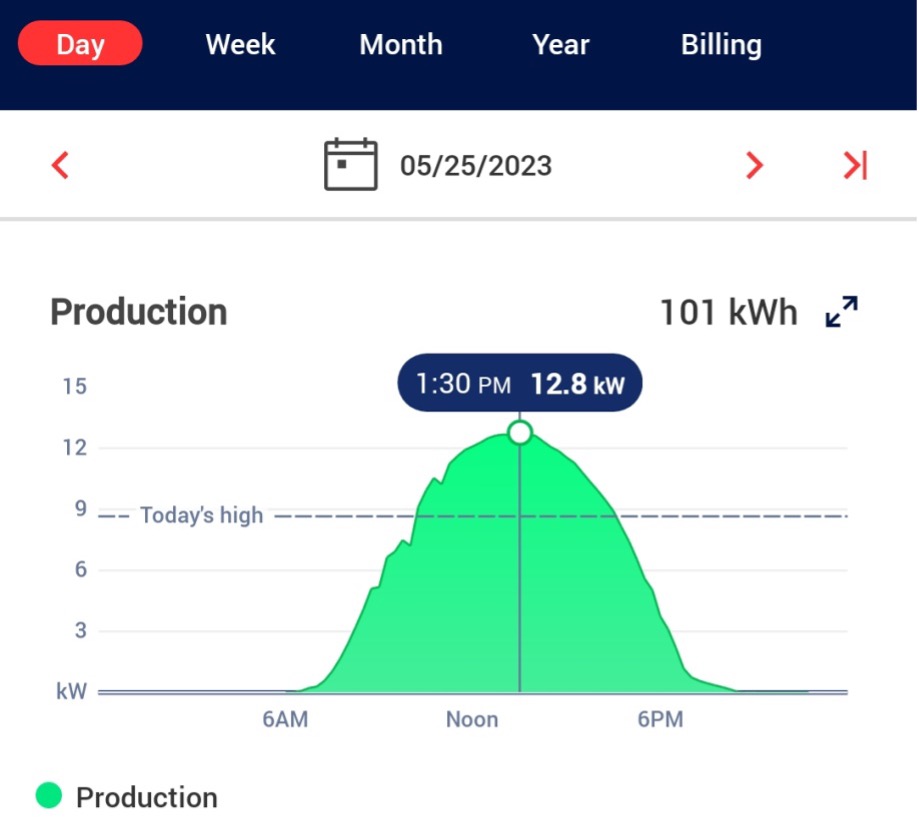
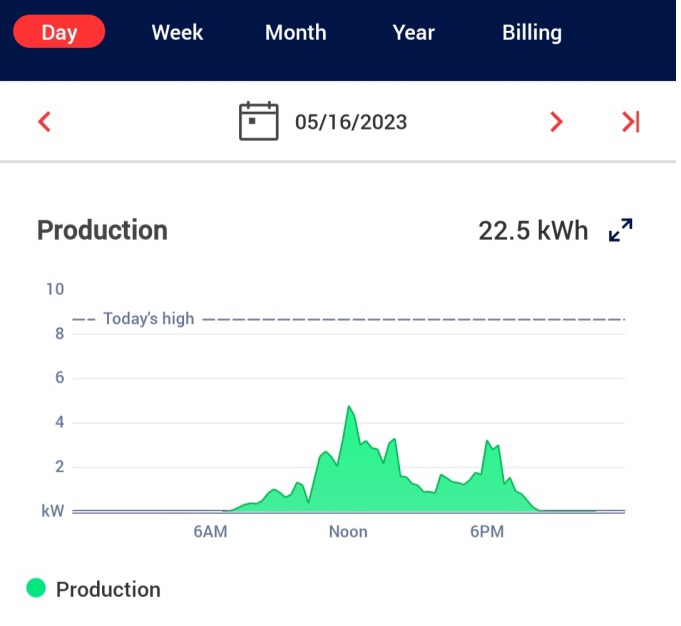
Our best day all year was May 25 (101 kWh), but just a few days earlier on May 16 the production was only 22.5 kWh because of heavy rain and thick clouds all day.
Daily production characteristics:
Netmetering
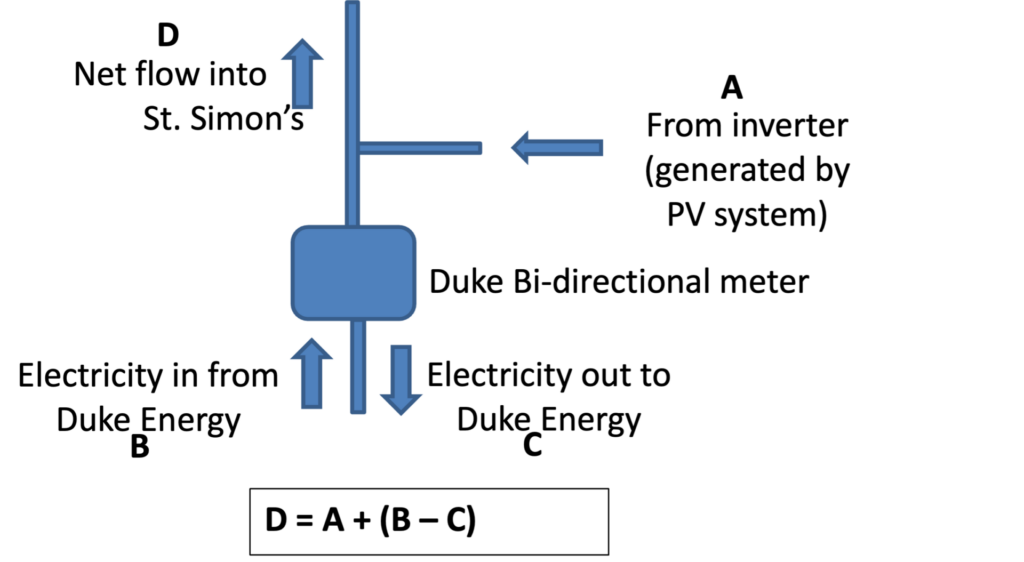
Netmetering of the system by Duke began on Dec 28, 2022. A diagram of the flows of electricity in and out of the church meter and the PV is shown in Figure 5. The amount of electricity actually used by the church is given by the expression D = A + B – C. The amount of electricity billed by Duke on the other hand, is E = B – C
The flows of energy recorded by Duke (B and C) and from the PV system (A) as reported by the Solar Edge app are shown in the table. All units are kilowatt-hours.
| Month | A (solar production) | B (Duke supplied to us) | C (we provided to Duke) | D (used by church) | E (billed by Duke) |
| Jan 2023 | 642 | 908 | 425 | 1125 | 483 |
| Feb 2023 | 1380 | 799 | 1145 | 1035 | -345 |
| Mar 2023 | 1500 | 750 | 962 | 1288 | -212 |
| Apr 2023 | 1840 | 400 | 1368 | 872 | -968 |
| May 2023 | 2301 | 416 | 2076 | 641 | -1660 |
| Jun 2023 | 2010 | 1040 | 948 | 2102 | 92 |
| Jul 2023 | 2180 | 2951 | 529 | 4602 | 2422 |
The negative numbers in column E represent months in which our PV system sent more electricity to Duke than we used. For this we got a credit, to be applied during the year to months where we used more electricity than we generated.
Environmental Benefit
Using solar energy avoids the production of greenhouse gases by the utility, especially carbon dioxide (CO2). The amount of CO2 per MWh of electricity produced by utilities in our region (RCFW) can be found at https://www.epa.gov/egrid/power-profiler#/RFCW and is 1166 lb of CO2 per MWh. In 2022-23 we avoided the use of 21,768 kWh (21.8 MWh) of electricity. This was determined by comparing the average electricity use over the four previous years (26,958 kWh) to the amount sold to us by Duke Energy in 2022-2023 (5,190 kWh).
26,958/yr pre-solar – 5,190/yr with solar = 21,768 kWh/yr avoided.
Multiplying 21.8 MWh by the factor of 1166 given by the EPA gives 25,400 lbs of CO2 avoided.
To convert this to things we can more easily relate to, go to the EPA equivalent website: https://www.epa.gov/energy/greenhouse-gas-equivalencies-calculator.
There you can find that 25,400 lb of CO2 avoided is equivalent to removing 2.6 cars from the road every year, or to 190 trees planted each year and grown for 10 yr.
Estimating Financial Savings
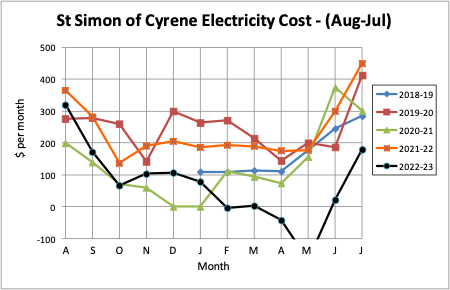
Figure 6 shows St. Simon’s electricity cost for meter #108149853 over the past several years. I’ve taken the start of the year to be August to coincide with the time of the start of the PV system. Thus the costs shown for a given year include August through December of one year and January through July of the next. Note there’s quite a bit of variation in cost per year, reflecting changes in building use (this time encompasses COVID years) and weather. For the past year, 2022-23, which is the time for which the PV system was operational, you can see that the cost was not really significantly reduced until after December, when the economic benefits of net metering began. Before then, although we were getting some benefit due to the reduced amount of power we had to buy from Duke, we were not getting any credit for excess production we might have had. After January, the cost reduction (black line) was quite striking.
It is worthwhile to try to estimate the amount of annual cost saving due to the PV system. I tried this via two methods:
- Method 1 – I took the annual electricity cost for each of the past 3 years and averaged them to find an average cost of $2455. The cost for the past year (Aug ‘22 – July ’23) was $828. The difference, or savings, is $1627.
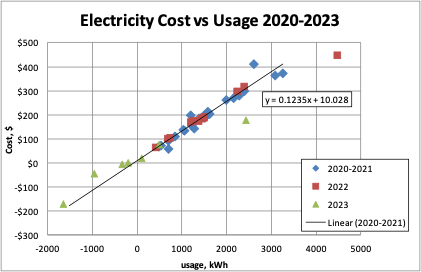
- Method 2 – I took the monthly usage and cost data for the years 2020 through 2023 and plotted cost vs usage (kWh) for each month. The result is shown in Figure 7, and a good linear regression line can be fitted to describe the relationship between usage and cost:
Cost = 0.1235*kWh + 10.0. This is the pre-PV system baseline. To find the amount it would have cost to buy our electricity pre-PV, I put in the actual usage. 19,460 kWh, into the equation and came up with $2408. Our actual cost was $828 The difference, $1580, would be our savings for the year.
The two estimates are quite close, suggesting we likely saved about $1600 over the past year by having our PV system in operation. The estimates may be a bit low because netmetering was only in effect for half the year, and it appears to have lowered our cost compared to when we didn’t have netmetering.